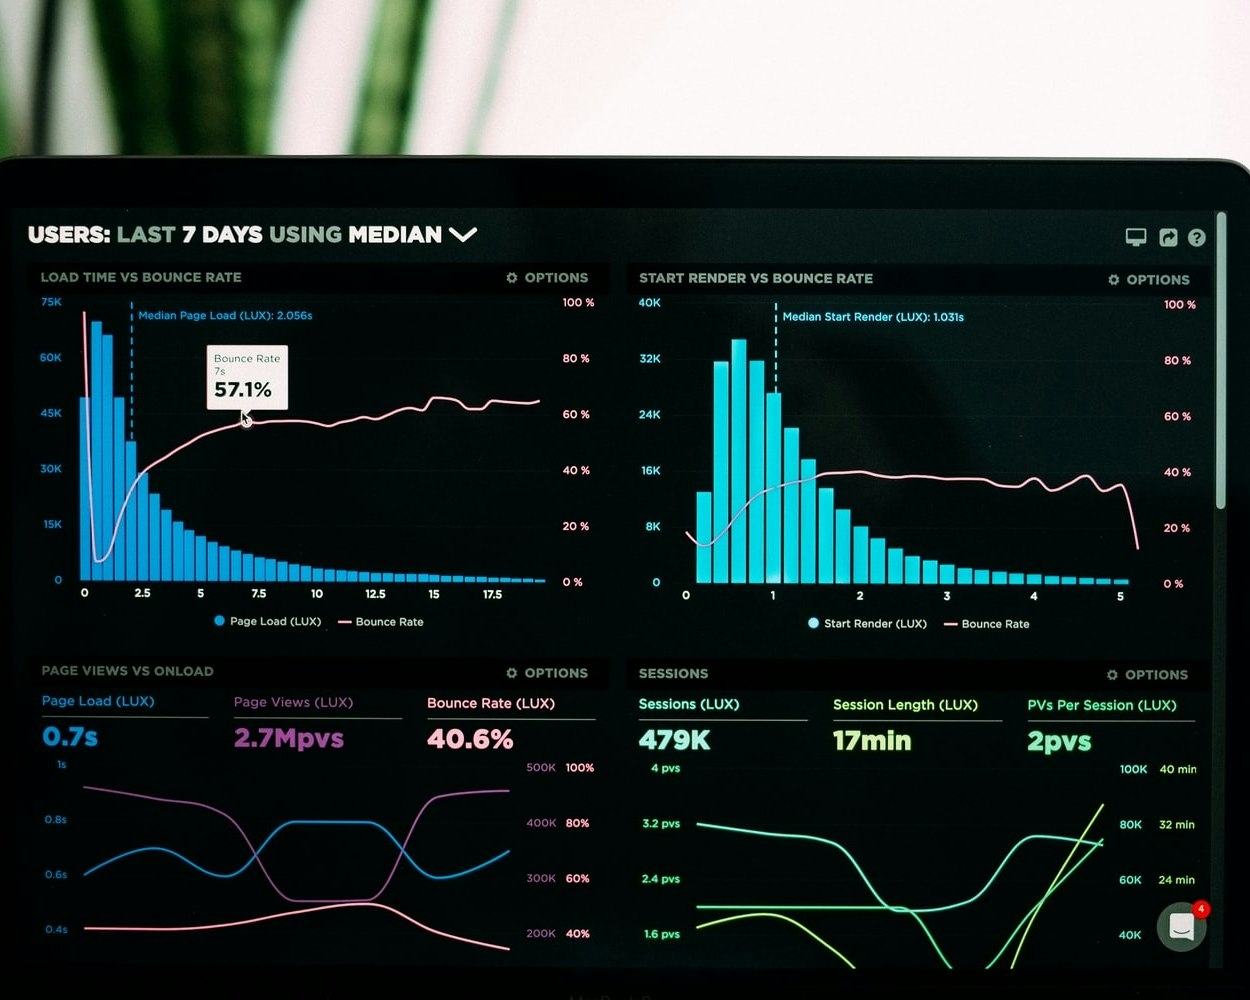
Helping companies operate more efficiently with data
We provide this service together with tidydata
ACTIONS BASED ON FACTS, NOT GUESSES
Responsible people begin work on any project with an analysis of the situation and make decisions based on facts, not guesswork. There is always an intuitive idea of the situation, but an accurate program requires the collection of additional information. Investing in analytics helps you to act with confidence and not waste significantly more money.
For convenience, all services in this area are grouped into three conditional groups:
- Marketing research,
- web analytics,
- sales and assortment.

Marketing research
RECOGNITION
It is difficult to acquire something that you do not know about yet.
Business goal: selection of advertising tactics, marketing and PR assessment.
Tools: questionnaire. Top of Mind, Spontaneous Knowledge, Induced Knowledge, Knowledge / Conversion Matrix
Example: Company X has invested most of its advertising budget in reach campaigns aimed at increasing brand awareness. As a result of a survey of the target audience, it was revealed that brand knowledge is at the level of market leaders, and conversion (the ability to turn knowledge into purchases) is much lower. The resulting decision to change the communication messages helped to rectify the situation.
IMAGE
How does the market perceive your brand?
Business goal: to strengthen positioning, create a strong brand
Tools: perception maps
Example: actual product characteristics (price, reliability, style, etc.) and the perception of these characteristics by the audience may differ. Image analysis helps to build a holistic picture, find points of strengthening the brand image and its positioning in the market.
ANALYSIS OF THE TARGET AUDIENCE
Who is the target audience? What segments are there in the customer base?
Business goal: effective use of the marketing budget. Finding new audiences
Tools: Affinity Index, Cluster Analysis, Social Media Analysis
Example: The likelihood of a purchase greatly depends on the characteristics of the audience. Out of 100 male programmers 25-29 years old, three will buy your products, and out of 100 male marketers 30-34 years old, only one. Which audience requires three times less effort to attract? Well, you get the idea ...
Another example. The analysis of search queries helped to identify a small segment of the audience, whose needs differ significantly from those of typical buyers. Before buying, they went to the site for the queries "... for big people", "... for men weighing 110 kg." The main buying driver for them is reliability, not design (as for the rest). Advertising campaigns with customized messages targeting the new segment were particularly effective.
PURCHASE DRIVERS and BARRIERS
What features of the product are used to buy it?
Business goal: product improvement, marketing communication content selection
Tools: Kano method, importance / satisfaction matrix, conjoint analysis
Example: guided by intuitive ideas, marketers have invested in advertising product characteristics that are not important to the market.

Web analytics
ANALYSIS OF TRAFFIC SOURCES
Half of the budget is wasted. Which one?
Business goal: optimization of the advertising budget, increasing the return on investment in advertising.
Tools: audit of advertising channels, end-to-end analytics.
Example: web analytics helps to assess the path and cost of customer acquisition, with details down to banners or key phrases.
WEBSITE AUDIT
We are looking for ways to increase conversion.
Business goal: increase online sales
Tools: Google Analytics, Yandex.Matrika
Example: 60% of the total number of website visitors go to the catalog -> of which 3% add products to the cart -> of which 32% place an order -> from 68% of them make a payment. You can buy even more traffic. Or you can earn more by increasing conversions at the current level of advertising costs.
CLIENT SEGMENTATION
We personalize marketing based on CRM data.
Business goal: increasing the efficiency of communications.
Tools: CRM systems, RFM segmentation, cluster analysis.
Example: the share of read letters of customized e-mail newsletters can be up to two times higher than standard ones. Highlight groups of people who buy more and more often to tailor the offer in line with customer value.

Sales and assortment
Sales forecasting, assortment optimization
FORECASTING AND MODELING
Looking to the future with statistics.
Business goal: increasing sales, retaining customers, optimizing costs
Tools: mathematical modeling, time series forecasting
Example: computer algorithms help to predict sales, customer (or employee) churn, the probability of purchase on the website, and even the outcome of student learning with high accuracy.
ASSORTMENT
How will you earn in the next period?
Business goal: optimization of assortment, purchases, reduction of working capital and costs of spoilage / storage.
Tools: ABC analysis, analysis of turnover and assortment structure.
Example: lack of goods in stock reduces the number of sales; excess stocks "eat up" working capital; the surplus is susceptible to deterioration and takes up space in the warehouse.
TYPICAL SHOPPING KITS
What SKUs are bought together more often?
Business goal: increase the share of spontaneous purchases
Tools: analysis of association rules
Example: recommendations and layout based on typical sets helps to multiply the share of related sales.
DASHBOARDS
Director's tablet: key metrics on one screen.
Business goal: monitoring current performance
Tools: dashboards, interactive tables and graphs
Example: implementing a dashboard helps to get a summary of key indicators without waiting for the reports of accountants / analysts. Anytime, anywhere with the internet.